
Fig. 2. Temporal consistency of strategy use—the Established Colony.
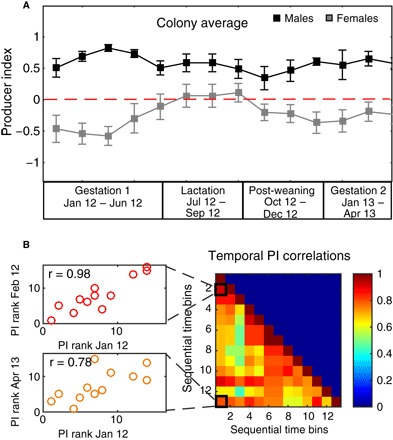
(A) Average PI + SE for males (black, n = 6) and females (gray, n = 9). The female reproductive periods are denoted along the x axis. Notice that the average female PI is positive in July-August-September. (B) There were high correlations between monthly PI ranks (n = 16), implying that even when bats changed strategy use, they maintained a relative order; that is, individuals that were stronger producers remained stronger and vice versa. Left: An example of the correlation between the first and second time bins (January and February 2012; r = 0.9, P = 0) and between the first and last time bins (r = 0.78, P = 0.001, January 2012 and April 2013). Right: Temporal correlation matrix. Each cell denotes the Spearman correlation coefficient between two time bins (1 to 2 months each). The color indicates the strength of the correlation. All correlations were significant [P < 0.05, following a false discovery rate (FDR) P value adjustment for multiple comparisons] except for those of bin 3 with 6, 7, 9, and 12 representing March 2012 and June 2012/July 2012/August 2012/February 2018) which had P values between 0.1 and 0.06.