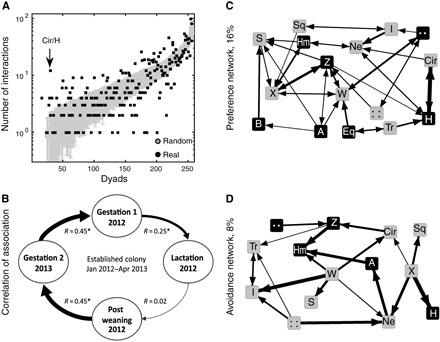
Fig. 3. Bats exhibit individually specific social preferences—the Established Colony.

(A) The number of observed and expected dyadic interactions (y axis) for each of the 240 possible directional dyads (x axis). Expected interactions (mean + SD) are depicted by gray bars and are sorted by their values. The corresponding observed number of interactions is depicted by a black dot. Note that dyads are directional. (B) The social foraging network was stable over time. There were significant correlations between the temporal interaction matrices representing the different reproductive periods except between lactation and postweaning. Each circle represents a reproductive period, with thickness of the connective arrows representing the strength of the correlation coefficient between the social foraging networks of two reproductive periods. *P < 0.001 (Mantel test with a Bonferroni correction). (C and D) Preference and avoidance social foraging networks containing only those ties that significantly exceed (that is, preference) or fall below (that is, avoidance) their expected values. Black nodes, males; gray nodes, females. Networks are weighted and directed. Arrows indicate the directionality of the relationship with the arrowhead pointing toward the producer in the dyad and the thickness of the arrows representing the relative strength of the relationships (in the case of double-sided arrows, the thicker arrowhead represents the stronger of the directional ties). The numbers on the left of each network represent the proportion of dyads out of the total 240 possible dyads in the full network.
