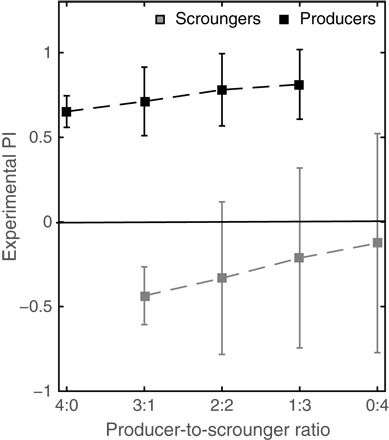
Fig. 4. Flexibility in strategy use in social bats.

Experimental PI as a function of the producer-to-scrounger ratio. The average (+SD) for all producers (black) or scroungers (gray) at each ratio is shown. Notice how some of the scroungers start producing (PI > 0) when the ratio is above 2:2, as denoted by the fact that the SD crosses the 0 line. The overall average scrounger PI does not cross zero because the individual strategy diverges with some individuals maintaining their old scrounging tendency and others switching to producing.
