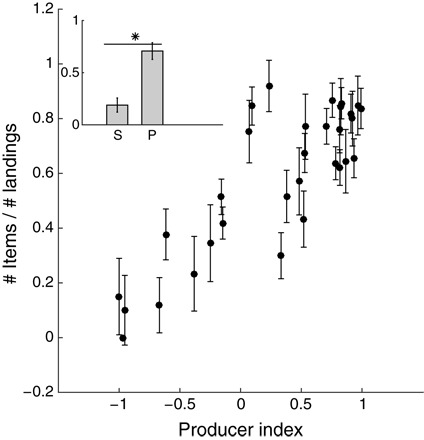
Fig. 5. Collecting-to-landing ratio as a factor of PI.

The y axis shows the average overall number of fruit items collected divided by the overall number of landings on the food source, and the PI of the bats in Wild Control Colony 2 (n = 32) is presented on the x axis. The average + SE collection-to-landing ratios for scroungers “S” and producers “P” are inserted in the upper left corner. The asterisk denotes significant differences (P < 0.01).
