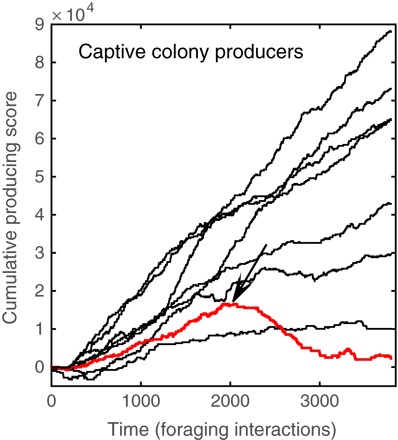
Fig. 6. Fine-scale temporal analysis of producing/scrounging.

We used an Elo rating–inspired algorithm to examine the temporal dynamics of strategy use (84). The x axis represents time, with each bin representing one interaction event. The y axis represents the cumulative producing score, and each line represents one individual (notice that the graph only includes positive scores, that is, of producers). The analysis above shows cumulative producing scores of all male producers, which consistently increase, indicating the consistent use of the producer strategy. In red, the producer score of individual “B” initially increases as in the case of producers, until he was injured (the date of injury is denoted by an arrow), after which his score consistently drops, reflecting a change in strategy from producing to scrounging.
