
Fig. 2. Activity in auditory cortices synchronizes to the speech envelope across rates.
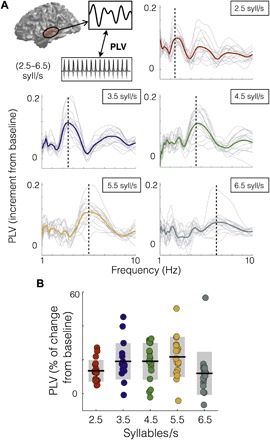
(A) Increment from baseline of PLV between auditory cortex and the envelope of the sound as a function of frequency. The panels correspond to different syllable rate conditions. Light gray lines, individual subject data; colored line, mean across subjects (red, 2.5 syllables/s; blue, 3.5 syllables/s; green, 4.5 syllables/s; yellow, 5.5 syllables/s; dark gray, 6.5 syllables/s). Vertical line, stimulus rate. (B) Mean PLV around the syllable rate of each condition (syllable rate ±0.5 Hz). Dots, individual participants; black lines, mean across participants; shadowed region, SD.