
Fig. 4. Correlation between auditory-motor PLV and auditory-speech PLV.
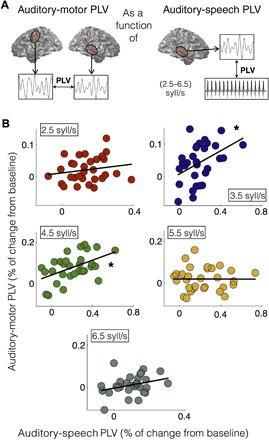
(A) Schematic of analysis. (B) Contralateral motor-auditory PLV as a function of the corresponding auditory-stimulus PLV. Each panel represents a different syllable rate condition (red, 2.5 syllables/s; blue, 3.5 syllables/s; green, 4.5 syllables/s; yellow, 5.5 syllables/s; dark gray, 6.5 syllables/s), and the black line represents the linear fitting of the data. Asterisk (*) shows significant correlation between variables (P < 0.05, FDR-corrected).