
Fig. 3. Comparative analysis of telomerase expression.
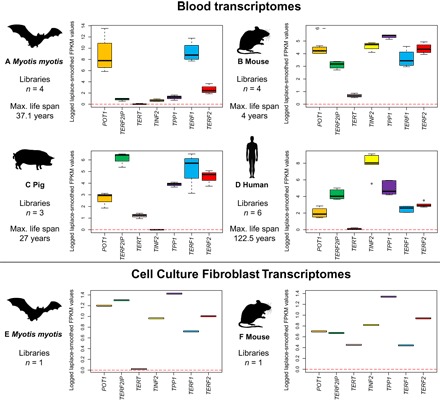
Analysis of telomerase expression (TERT) in blood transcriptomes of (A) M. myotis, (B) mouse, and (C) pig, and (D) human and fibroblast cell cultures in (E) M. myotis and (F) mouse. Expression of other shelterin genes (POT1, TERF2IP, TINF2, TPP1, TERF1, and TERF2) is provided as a comparison to TERT expression levels within species. Note that scales differ between plots.