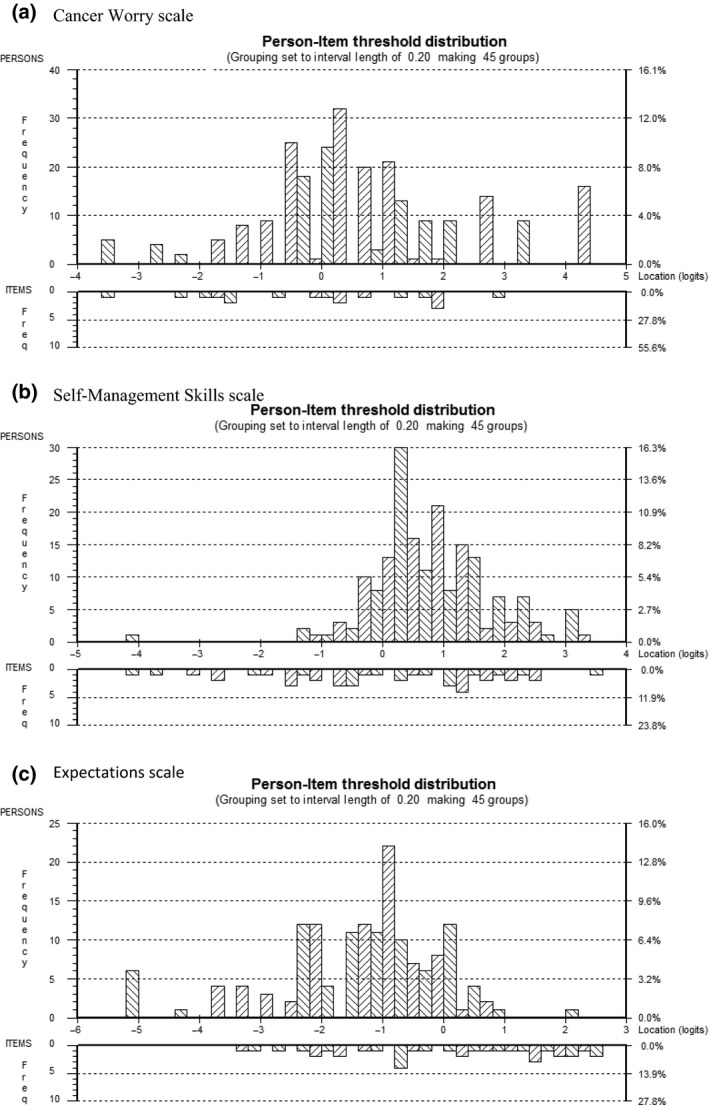
Figure 2.

Targeting of scale to sample (person‐item threshold locations spread). (a) Cancer Worry scale. (b) Self‐Management Skills scale. (c) Expectations scale.The x‐axis symbolizes the construct with cancer worry, self‐management skills and ‘realistic’ expectations increasing to the right. The y‐axis shows the frequency of person measure locations (top histogram) and item locations (bottom histogram).
