
Figure 2.
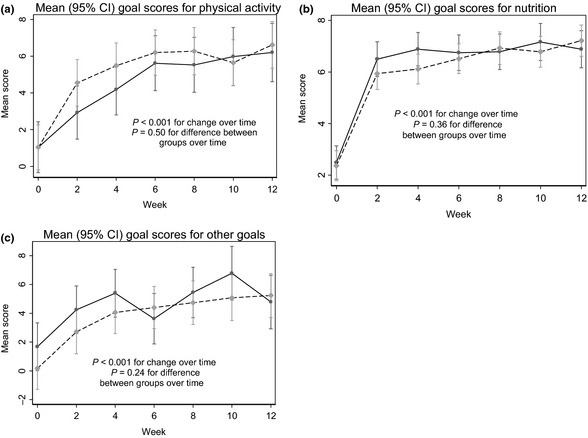
(a–c) Changes in self‐rated physical activity, nutrition and other goal scores over the 12‐week Intervention. Mean (95% CI) changes in scores over the 12‐week intervention for physical activity, nutrition and other goals. ( ) Group 1; (
 ) Group 2.