Figure 2.

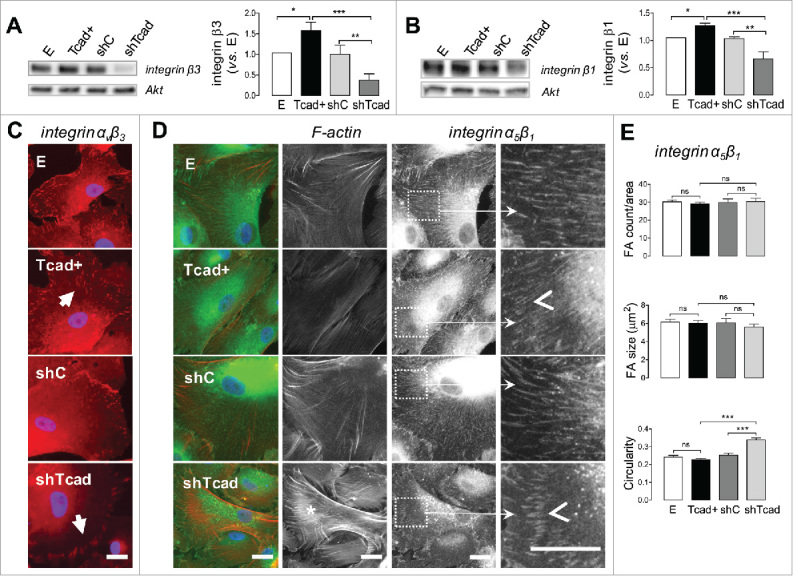
T-cadherin-based SMC phenotype switch alters morphology and distribution of integrin-ανβ3 and integrin-α5β1 specific cell-matrix adhesions. SMC transductants were plated onto fibronectin pre-coated tissue culture dishes or glass coverslips for immunoblotting or immunocytochemistry protocols, respectively. (A, B) Representative blots of integrin β3, integrin β1 (with Akt as internal loading control) are presented and quantification of abundancies in the different transductants is expressed relative to levels in control E SMC. Obtained data are presented as mean ± SD. One-way ANOVA followed by Tukey post-hoc testing was used for statistical analysis. Asterisks indicate significant differences. (*P <0.05; **P <0.01; ***P <0.001). (C, D) Representative images of SMCs after 2 h of spreading on fibronectin. Scale bars = 25 µm. (C) SMCs stained for integrin-ανβ3 (red), and nuclei (blue). Note the prominent FAs on the periphery of shTcad-SMCs and the smaller scattered FAs in the lamellar regions of Tcad+-SMCs (indicated by closed arrowheads). (D) SMCs stained for fibrous actin (F-actin; red), integrin α5β1 (green), and nuclei (blue). F-actin and integrin α5β1 channels are separately presented in grayscale to the right of the merged color images. Pronounced actin bundles characteristic of shTcad-SMCs are indicated by the asterisk *. To highlight differences in integrin α5β1-specific FA morphology high magnification fragments (white squares) are presented: open arrowheads point to the distinct morphometries of shTcad-SMCs (short, thick ordered FA arrays) and Tcad+-SMCs (longer, thin FA arrays). (E) Morphometric quantification of integrin α5β1-specific FAs in each transductant with respect to number/area, size and circularity. Obtained data are presented as mean ± SD. One-way ANOVA followed by Tukey post-hoc testing was used for statistical analysis. **P ***P <0.001;. ns, not significantly different.
