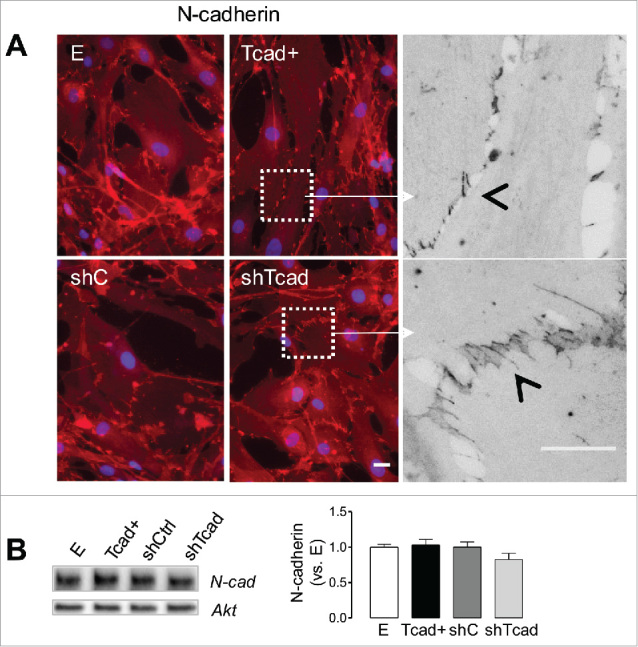
Figure 3.

T-cadherin-associated SMC phenotype switch alters morphological properties of N-cadherin positive AJs. SMC transductants were plated onto fibronectin pre-coated glass coverslips or tissue culture dishes for immunofluorescence staining or immunoblotting protocols, respectively (A) Representative images of SMCs stained for N-cadherin in confluent cell monolayers. Scale bars = 25 µm. Higher magnification fragments (white squares) from Tcad+- and shC-SMCs (in grayscale) illustrate the very different patterns of N-cadherin distribution at cell-cell junctions. Cell-cell interface and cadherin fingers are indicated by the open arrow heads. (B) Representative immunoblots of N-cadherin (with Akt as internal loading control) are presented and quantification of abundancies in the different transductants is expressed relative to levels in control E SMC. Obtained data are presented as mean ± SD.
