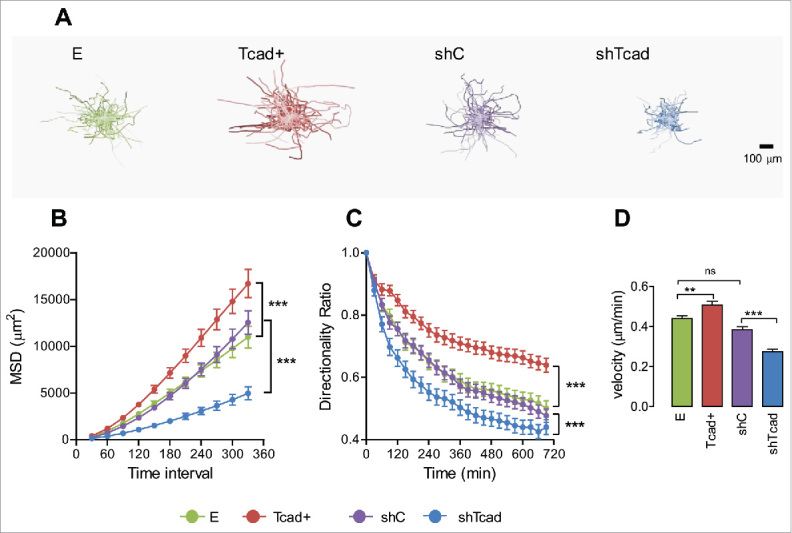
Figure 4.

Dedifferentiated and contractile SMC phenotypes exhibit different modes of random cell migration in 2D monolayer culture. Migration of SMC transductants sparsely seeded onto fibronectin pre-coated culture was recorded by time lapse videomicroscopy. (A) Upper panels show typical plots of trajectories from migration origin (n = 100 cells/transductant). (B) Mean square displacement (MSD) was calculated as a measure of migration efficiency. (C) The directionality ratio (or straightness ratio) was calculated as a measure of directional persistence: each data point represents the directionality ratio at the given specific time point. Statistical analysis of data for directionality ratio and MSD was performed using nonlinear regression analysis. Significant differences between E and Tcad+ and between shC and shTcad are indicated (****P < 0.0001). E and shC were not different. (D) Migration velocity. Each data point (mean ± SEM) represents measurements on 100 cells in 3 independent experiments. One-way ANOVA followed by Tukey post-hoc testing was used for statistical analysis. Asterisks indicate significant differences (**P < 0.01; ***P < 0.001). ns, not significantly different.
