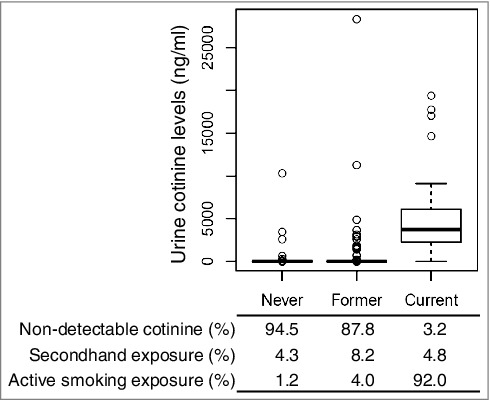
Figure 1.

Cotinine concentrations by self-reported smoking status. A comparison of urine cotinine concentrations with self-reported smoking status reveals potential misclassification; cotinine detection limit: 8 ng/ml; active smoking levels: >100 ng/ml (urine). Boxplots show cotinine concentrations (ng/ml, y-axis) with self-reported smoking status (420 never smokers, 458 former smokers, 63 current smokers). The bold horizontal line represents the median, the top and bottom borders of the box represent the 75th and 25th percentiles, respectively, while the circles represent outliers.
