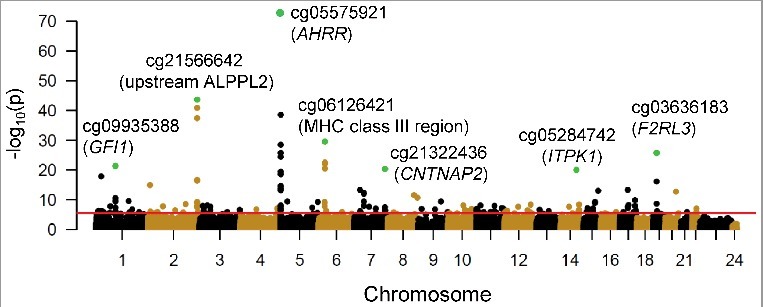
Figure 2.

Cotinine concentration associations with DNA methylation in 930 CD14+ monocyte samples. A Manhattan plot shows the significance [-log10(P value), y-axis] resulting from the association between log urine cotinine levels (ng/ml) and DNA methylation for each of the 484,817 CpG sites investigated (represented as circles). CpGs are ordered by chromosome and chromosomal position (x-axis). The red line represents a false discovery rate of 0.01, corresponding to a P value ∼ 3.8 × 10⁻⁶. Green circles represent the most significant association detected at the top seven genomic loci harboring cotinine-associated methylation profiles; nearby genes include: growth factor independent 1 transcription repressor (GFI1), aryl-hydrocarbon receptor repressor (AHRR), contactin associated protein-like 2 (CNTNAP2), inositol-tetrakisphosphate 1-kinase (ITPK1), and F2R-like thrombin/trypsin receptor 3 (F2RL3).
