
Figure 3.
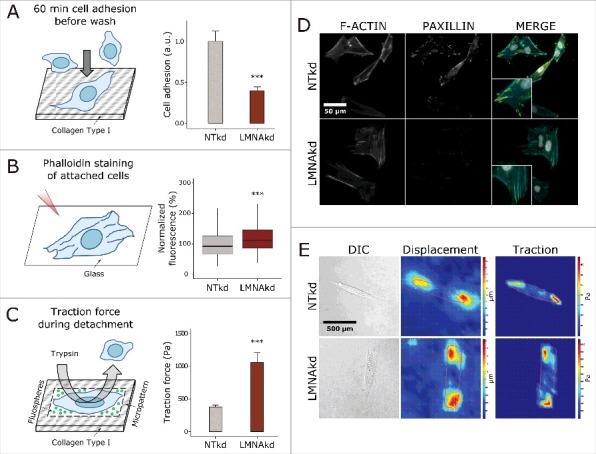
LMNAkd reduces adhesive capacity, but increases contractile tension. (A) Schematic overview of the colorimetric cell adhesion assay (left) and barplot of the results of the assay, expressed relative to NTkd cells (right). Error bars indicate the standard deviation on the mean value of 10 replicates. (B) Schematic overview of the rhodamine phalloidin staining used to characterize stress fibers of attached cells (left) and box plot of the normalized mean fluorescence intensity (relative to NTkd cells (%)) of stress fibers per cell (right). Phalloidin staining was conducted in triplicate and a minimum of 100 cells were imaged per replicate. In the boxplot the horizontal line indicates the median, boxes the 25th and 75th percentile, and whiskers the 5th and 95th percentile. (C) Schematic overview of the traction force microscopy experiment (left) and barplot of the maximum traction force in NTkd and LMNAkd cells (right). Error bars indicate the standard deviation on the mean value of 8 NTkd cells and 10 LMNAkd cells. (D) Representative images of NTkd and LMNAkd cells after immunofluorescence staining for paxillin (yellow), rhodamine phalloidin staining for actin (cyan) and counterstaining with DAPI (gray). (E) Representative DIC images, heat maps of the displacement and heat maps of the traction forces in NTkd and LMNAkd cells based on TFM measurements (see materials and methods for details). For the TFM experiment, significance was calculated with the Students t test; *** = p-value < 0.001. For the other experiments significance was calculated with the Wilcoxon rank sum test; *** = p-value < 0.001.