
Figure 4.
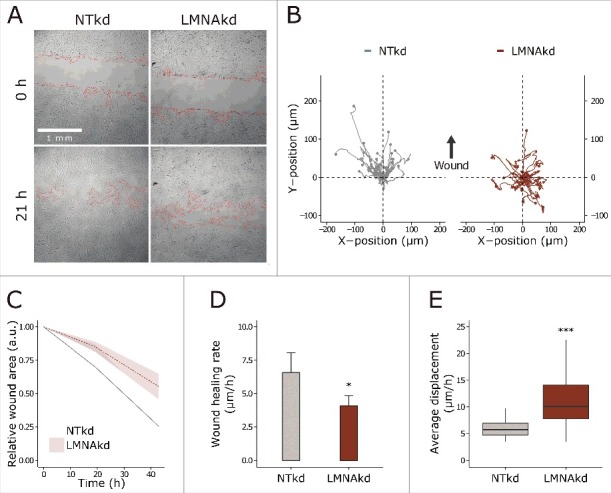
Lamin A/C depletion reduces wound healing potential, but increases single cell motility. (A) Representative transmission images of the wound healing assay at 2 time points (0 and 21 h) of the experiment, the wound area is delineated in red. (B) XY-movement of individual cells over 28 h, relative to the initial position. (C) Normalized wound area at different time points, relative to the initial wound area. The line is the mean value, the shaded region indicates the standard deviation on the mean value of 8 replicates. (D) Cell migration rate (µm/h) of NTkd and LMNAkd cells. Error bars indicate the standard deviation on the mean value of 8 replicates. (E) Average displacement (µm/h) of cells, measured by tracking individual cells in time-lapse images of a wound healing assay. The line is the mean value, the shaded region indicates the standard deviation on the mean value of 8 replicates. In the boxplots the horizontal line indicates the median, boxes the 25th and 75th percentile, and whiskers the 5th and 95th percentile. Significance was calculated in D with the Student's t-tes and in E with the Wilcoxon rank sum test; * = p-value < 0.05; *** = p-value < 0.001.