
Figure 5.
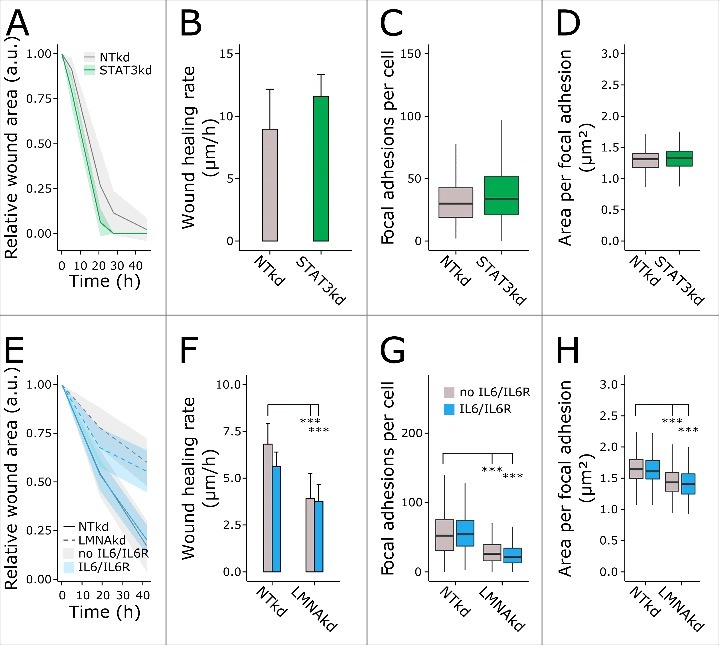
Impaired wound healing and FA after LMNAkd is not attributed to decreased STAT3 or decreased IL6/IL6R expression. (A) Normalized wound area at different time points, relative to the initial wound area, after STAT3kd compared to NTkd control. (B) Cell migration rate (µm/h) of control and STAT3kd cells. (C) Average number of FAs per cell after STAT3kd compared to NTkd control. (D) Area per FA (µm2) after STAT3kd compared to NTkd control. (E) Normalized wound area at different time points, relative to the initial wound area, after LMNAkd compared to NTkd control in presence (blue) or absence of IL6/IL6R (gray). (F) Cell migration rate (µm/h) of control and LMNAkd cells in presence (blue) or absence of IL6/IL6R (gray). (G) Average number of FAs per cell after LMNAkd compared to NTkd control in presence (blue) or absence of IL6/IL6R (gray). (H) Area per FA (µm2) after LMNAkd compared to NTkd control in presence (blue) or absence of IL6/IL6R (gray). The lines in A and E are the mean values, the shaded regions indicate the standard deviation on the mean value of 8 replicates. Error bars in B and F indicate the standard deviation on the mean value of 8 replicates. Immunofluorescent staining was conducted in triplicate and a minimum of 100 cells were imaged per replicate. In the boxplots the horizontal line indicates the median, boxes the 25th and 75th percentile, and whiskers the 5th and 95th percentile. For all figures, significance was calculated with either ANOVA or non-parametric contrast-based multiple comparison tests; *** = p-value < 0.001.