
Figure 6.
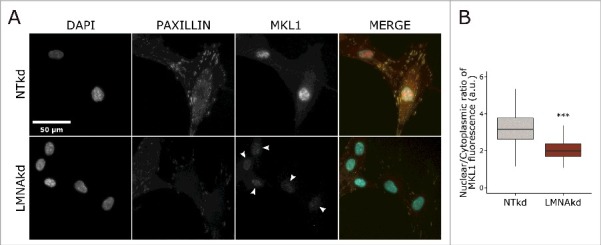
A-type lamin depletion reduces nuclear translocation of MKL1. (A) Representative images of NTkd and LMNAkd cells after immunofluorescence staining for paxillin (yellow), MKL1 (red) and counterstaining with DAPI (cyan). Arrowheads show reduced nuclear MKL1 in LMNAkd cells. (B) Normalized mean fluorescence (%) of nuclear MKL1 relative to NTkd cells. The immunofluorescent staining was conducted in triplicate and a minimum of 100 cells were imaged per replicate. In the boxplots the horizontal line indicates the median, boxes the 25th and 75th percentile, and whiskers the 5th and 95th percentile. Significance was calculated with the Wilcoxon rank sum test; *** = p-value < 0.001.