Figure 3.

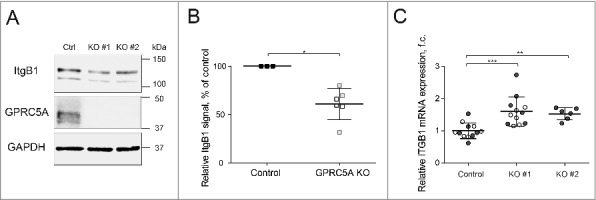
Knock-out of GPRC5A results in reduced β1 integrin protein expression. (A) Western blot demonstrating a reduction in the total integrin β1 (ItgB1) protein in GPRC5A knock-out MDA-MB-231 cells grown on Collagen I matrix (0.1 mg/mL) for 48 h. KO#1 and KO#2 refer to 2 independent small guide RNAs used for a CRISPR/Cas9-mediated GPRC5A knockout. (B) Quantification of integrin β1 protein from 3 independent experiments like the one shown in (A). Black lines show mean values. Error bars represent SEM. Statistical significance was evaluated using the Mann-Whitney non-parametric test. (C) RT-qPCR results demonstrate that, in contrast to the protein, the amount of the ItgB1 transcript is increased in GPRC5A knock-out cells. Statistical significance was evaluated using ANOVA with Tukey post-hoc test. *, p < 0 .05; **, p < 0 .01; ***, p < 0 .001.
