Figure 2.

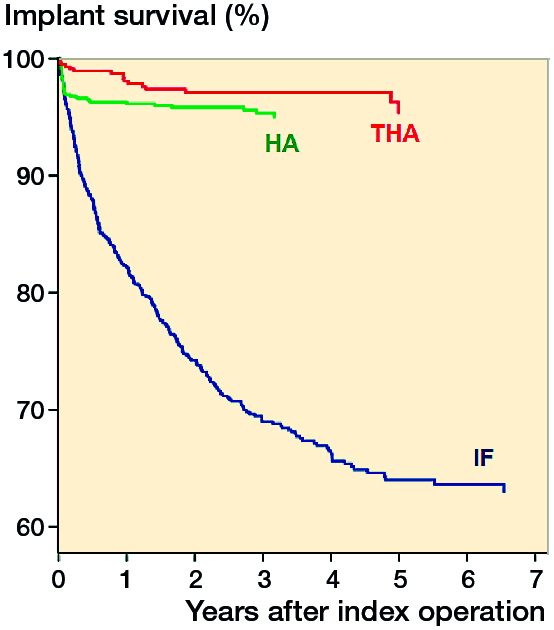
Adjusted survival of implants for the different treatment groups with major reoperations as endpoint, distributed by primary treatment method. Cox regression analyses with adjustments for age, sex, and ASA classification.

Adjusted survival of implants for the different treatment groups with major reoperations as endpoint, distributed by primary treatment method. Cox regression analyses with adjustments for age, sex, and ASA classification.