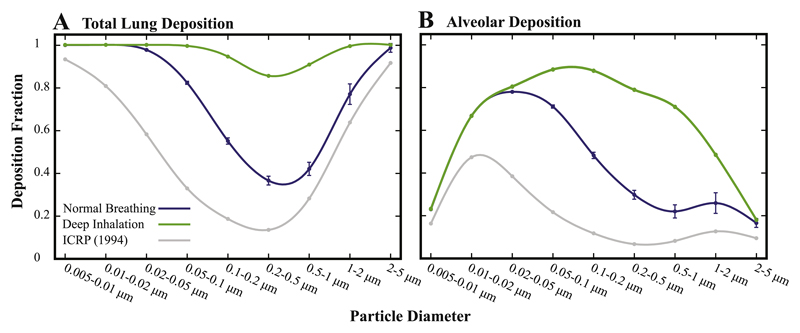
Fig. 8.
Predicted deposition fractions following deposition data in the sub-acinar models (see text for methodology); data for the full sub-acini represent mean ± SD (n = 5). (A) Total lung deposition fractions in the extra-thoracic and conducting airways and (B) alveolar deposition fraction compared to semi-empirical predictions (ICRP, 1994). Note that our predictions assume that particle deposition in extra-thoracic and conductive airways are taken from the ICRP (1994) study, assuming that deposition solely occurs during inhalation. (For interpretation of the references to color in this figure legend, the reader is referred to the web version of this article.)

