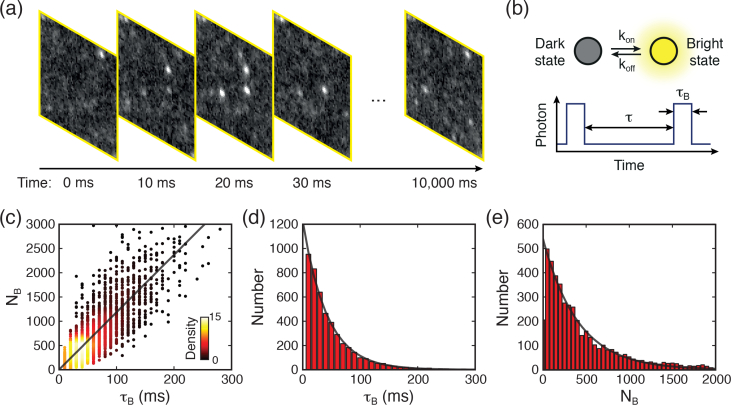
Fig. 9.
(a) Consecutive images acquired from poly-G DNA sample with time interval of 10 ms, showing blinking events. (b) The illustration shows a typical fluorescence switching process. (c) Fluorescent photon count NB versus blinking duration τB at Iex=7.14 kWcm−2. Color was used to denote the density of data spots. Histograms of (d) τB and (e) NB follow exponential distribution.

