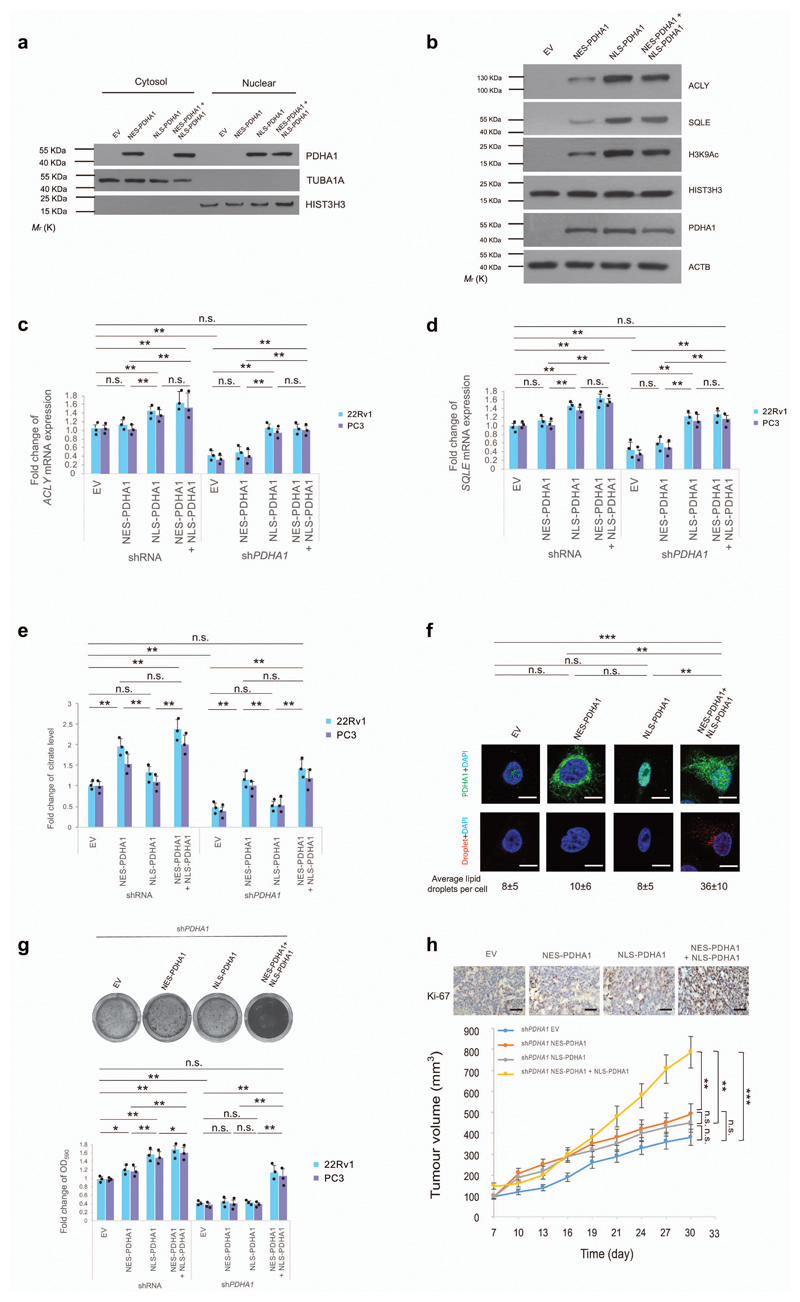
Figure 4. Nuclear PDC regulates the expression of lipid biosynthesis genes independently of mitochondrial PDC.
(a) Western blot analysis of indicated proteins in nuclear and cytoplasmic fractions of shPDHA1 22Rv1 cells infected with NES-PDHA1 and NLS-PDHA1 alone or in combination. Uncropped images are in Supplementary Figure 13. (n=3, independent cell cultures). (b) Western blot analysis of indicated proteins in shPDHA1 22Rv1 cells infected NES-PDHA1 and NLS-PDHA1 alone or in combination (see full panel in Supplementary Fig. 5b). Uncropped images are in Supplementary Figure 13. (n=3, independent cell cultures). (c-e) Quantitative real-time PCR analysis of mRNA expression for ACLY (c) and SQLE (d) and determination of citrate levels (e) in shRNA control and shPDHA1 22Rv1 and PC3 infected with NES-PDHA1, NLS-PDHA1 alone or in combination (n=3, independent cell cultures). (f) Representative confocal images and quantification of lipid droplets (average lipid droplets per cell) in shPDHA1 22Rv1 infected with NES-PDHA1, NLS-PDHA1 alone or in combination (n=3, independent cell cultures, Scale bar represents 10 µm, 5 fields acquired for each group). (g) Upper panel, representative images of crystal violet staining of shPDHA1 22Rv1 infected with infected with NES-PDHA1, NLS-PDHA1 alone or in combination (n=3, independent cell cultures). Lower panel, relative cell number quantification by crystal violet staining in shRNA control and shPDHA1 22Rv1 and PC3 infected with NES-PDHA1, NLS-PDHA1 alone or in combination (n=3, independent cell cultures). (h) Upper panel, representative micrographs in histopathological analysis of Ki-67 of these xenograft tumours. Lower panel, evaluation of tumour formation in xenotransplantation experiments of shPDHA1 22Rv1 infected with NES-PDHA1, NLS-PDHA1 alone or in combination (n=6 animals; 12 injections, Scale bar represents 50 µm, also see Supplementary Fig. 7d for the full panel). Error bars indicate s.e.m. *P < 0.05; **P < 0.01; ***P < 0.001. n.s, not significant.

