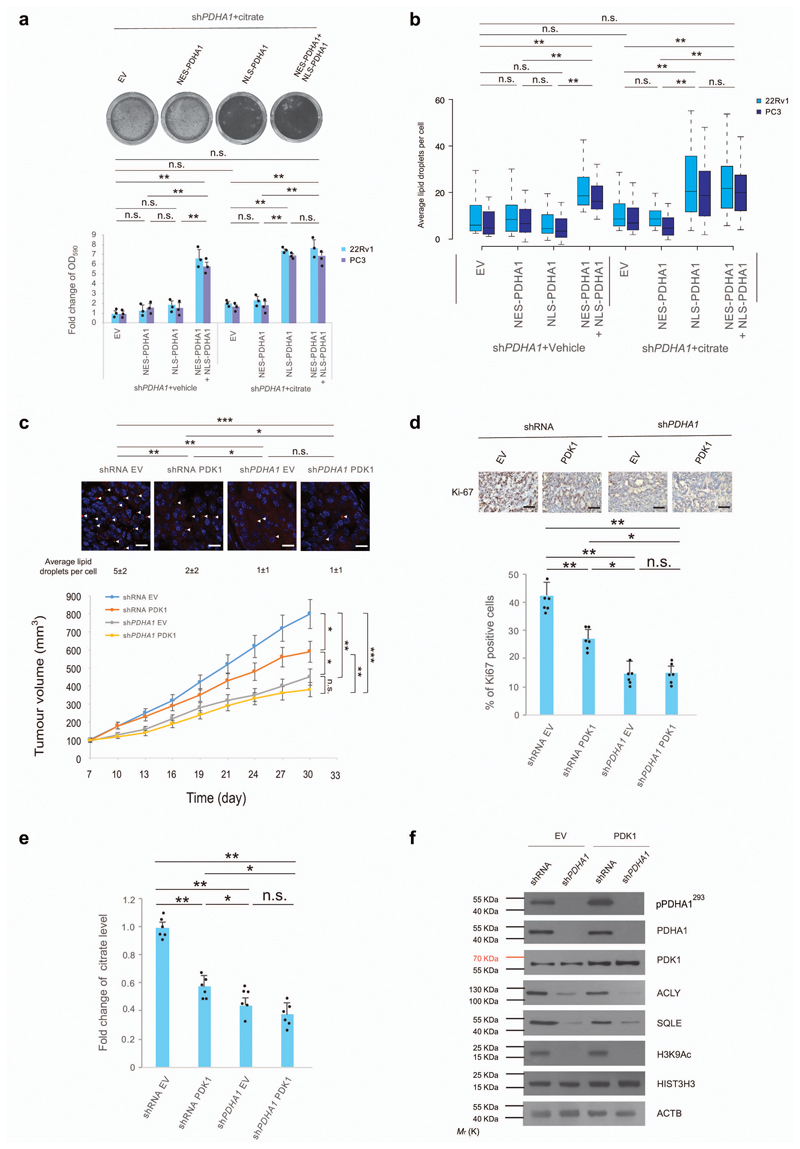
Figure 5. Nuclear PDC regulates fatty acid synthesis in presence of mitochondrial citrate.
(a,b) Relative cell number quantification by crystal violet (a, also see full panel in Supplementary Fig. 8a) and quantification by confocal microscopy of average lipid droplets per cell (b) in shPDHA1 22Rv1 and PC3 cells infected with NES-PDHA1, NLS-PDHA1 alone or in combination and treated with citrate (100 µM) or vehicle for 6 days (n=3, independent cell cultures). (c) Upper panel, Representative confocal images, and quantification of average lipid droplets per cell, in xenograft tumours from shRNA control and shPDHA1 22Rv1 cells infected with PDK1 or empty vector. Lower panel, Evaluation of tumour formation in xenotransplantation experiments in shRNA control and shPDHA1 22Rv1 cells infected with PDK1 or empty vector (n=6 animals; 12 injections, 5 fields acquired for each group and Scale Bar represents 20 μm). (d) Upper panel, representative immune-histochemistry micrographs for Ki-67 staining in tumours of the indicated genotypes. (n=6 animals; 12 injections, 5 fields acquired for each group and scale bar represents 50 μm). Lower panel, quantification of the percentage of Ki-67 positive cells in different tumour genotypes (n=6 animals; 12 injections, 5 fields acquired for each group). (e,f) Determination of citrate levels (e) and western blot analysis of indicated proteins (f) in xenograft tumours from shRNA control and shPDHA1 22Rv1 cells infected with PDK1 or empty vector. Uncropped images are in Supplementary Figure 13. (n=6, independent tumour samples). Error bars indicate s.e.m. *P < 0.05; **P < 0.01; ***P < 0.001. n.s, not significant.

