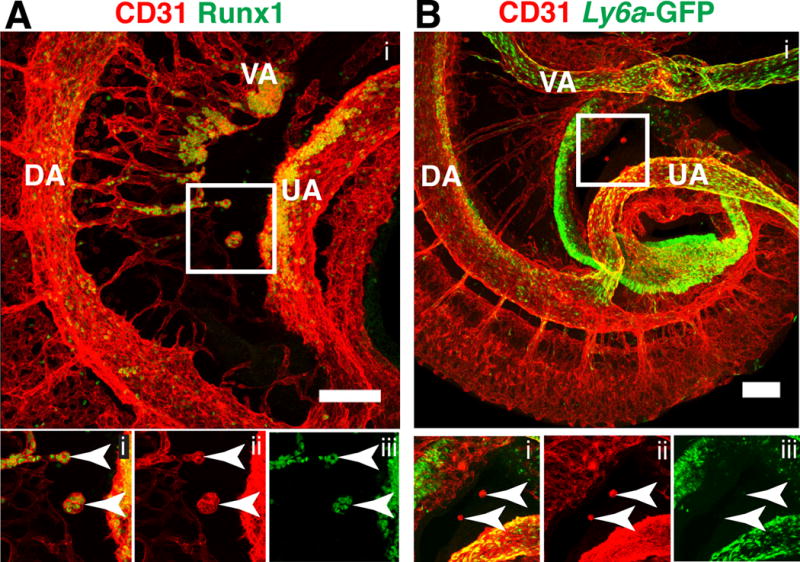
Figure 2. Extravascular islands localize between the remodeling vitelline artery and umbilical artery at E10.5.

(A) Z-projection of an E10.5 embryo immunostained for CD31 (i, ii) and Runx1 (i, iii). The embryo is oriented with its cranial end on the top and dorsal edge on the left. Lower panels are split channel views of the boxed region. Arrowheads in bottom panels indicate extravascular islands. Z-interval = 1.5μm, scale bar = 100μm. (B) Z-projection of an E10.5 Tg(Ly6a-GFP) embryo immunostained for CD31 (i, ii) and GFP (i, iii). Lower panels are split channel views of the boxed region. Arrowheads indicate extravascular islands. Z-interval = 5μm, scale bar = 100μm. DA = dorsal aorta, VA = vitelline artery, UA = umbilical artery.
