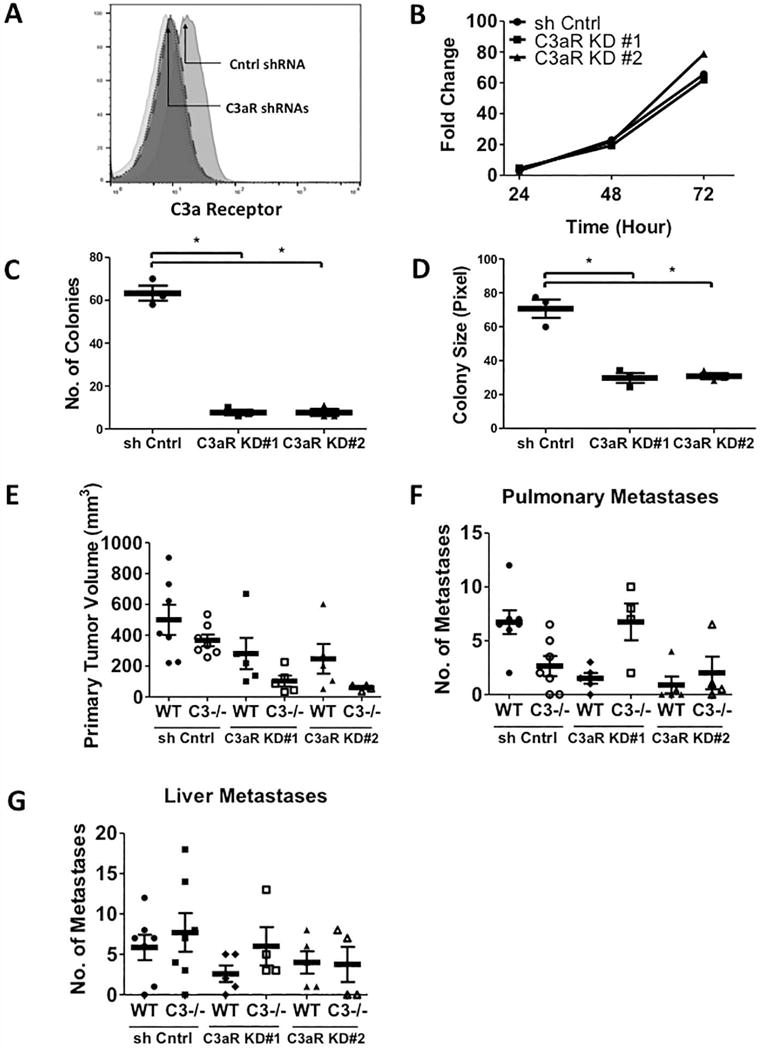
Figure 5. Silencing C3a Receptor Expression in LLC-luc Cells Inhibits the Primary Tumor Growth, but not metastasis in vivo.

(A) Flow cytometric analysis of cell surface C3a receptor expression on the two C3a receptor knockdown and control LLC-luc cell lines. (Isotype in light grey (median = 9.10); LLC-luc shRNA control on grey (median = 19.8); LLC-luc C3aR KD#1 in dark grey with small dotted line (median = 9.87); LLC-luc C3aR KD#2 in dark grey with big dotted line (median = 10.5)). (B) Fold changes in vitro proliferation of two C3aR knockdown LLC-luc cell lines are shown. (C and D) Numbers and sizes of C3aR KD LLC-luc colonies are shown in the anchorage independent assay. (E-G) The primary tumor volumes (E) and number of pulmonary (F) and liver (G) metastases induced by the two C3aR KD LLC-luc cell lines and the control shRNA cell lines are shown. The animals were sacrificed 21 days after the tumor implantation. (WT+C3aR KD#1 n = 5; C3−/−+C3aR KD#1 n = 5; WT+C3aR KD#2 n = 5; C3−/−+C3aR KD#2 n =4). * p<0.05 Error bars represent mean ± SEM.
