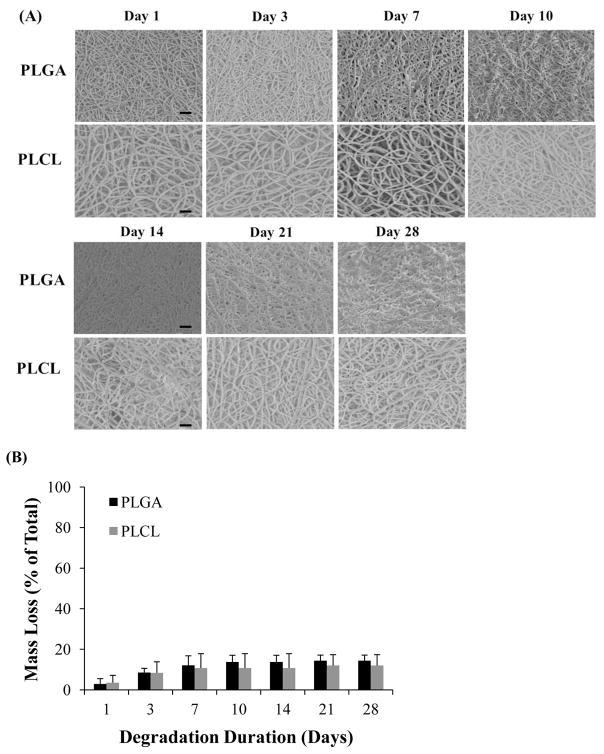
Figure 4.
(A) SEM microstructural degradation images of PLGA and PLCL EFs after 0, 3, 7, 10, 14, 21, and 28 days in SVF. Scale bar = 20 μm. (B) The corresponding percent mass loss relative to starting mass, resulting from 28 day degradation study. Only 12 to 14 % mass loss is observed after one month.

