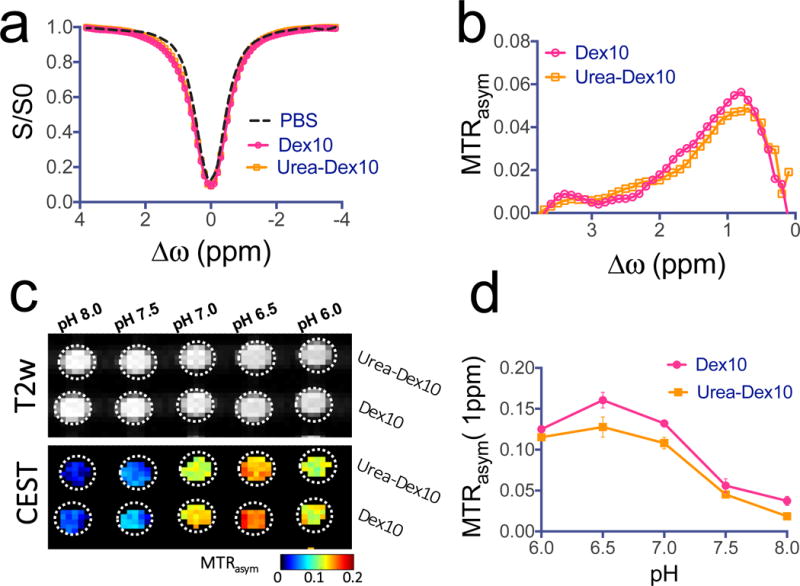
Figure 3. CEST MRI detection of dextrans.

a) Z-spectra and b) MTRasym plots showing the CEST effects of PSMA-targeted urea-Dex10 and non-targeted Dex10 at 1 mg/mL, pH 7.4 and 37°C. c) T2-weighted and CEST (MTRasym) images of 1 mg/mL urea-Dex10 and 1 mg/mL Dex10 at different pH values. d) Comparison of the pH dependence of the CEST signal at 1 ppm of urea-Dex10 and Dex10 at 1 mg/mL, pH 7.4 and 37°C, indicating the functionalization of Dex10 does not alter CEST effects. All measurements were acquired using a rectangular RF pulse with strength B1 = 4.7 μT and length tsat = 3 seconds. Molar concentrations of 1 mg/mL correspond to approximately 90 and 100 μM of urea-Dex10 and Dex10, respectively. Error bars are the standard deviations of three separate measures.
