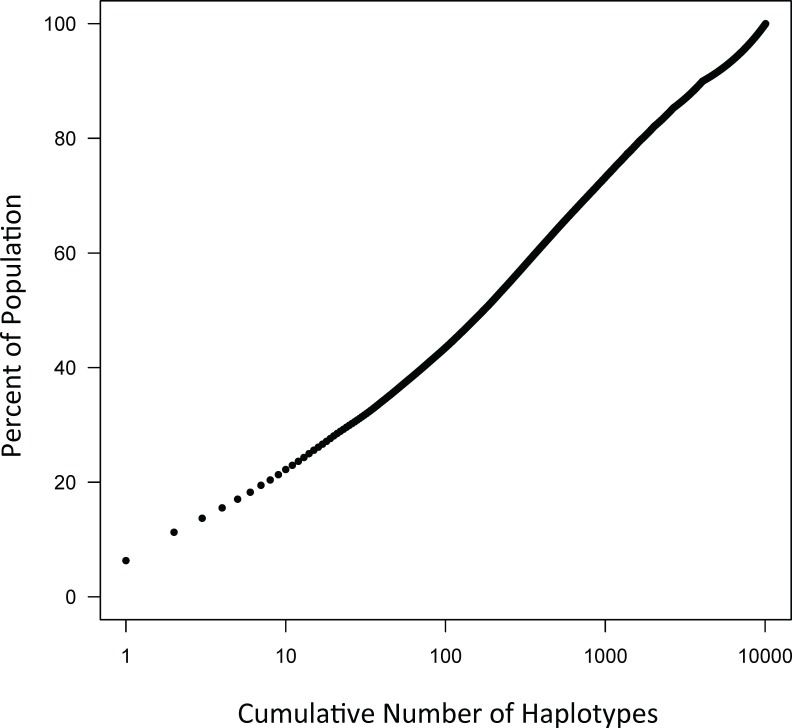
Fig 3. The WTCCC dataset consists of 59,884 haplotypes, of which 10,078 represent different (unique) combinations of the 5 HLA alleles and the SNP haplotypes (see text).
For the purpose of this graph, these unique haplotypes (CEHs) have been sorted according to their descending frequency of occurrence in the WTCCC dataset. The cumulative number of unique haplotypes (beginning with the highest frequency haplotype) has been plotted against the percentage of total number of haplotypes in the population. As can be appreciated from the graph, the large majority (~80%) of the different CEHs have only a very low frequency, whereas 80% of the haplotypes in the population are accounted for by only small number of very common CEHs (i.e., ~10 haplotypes).

