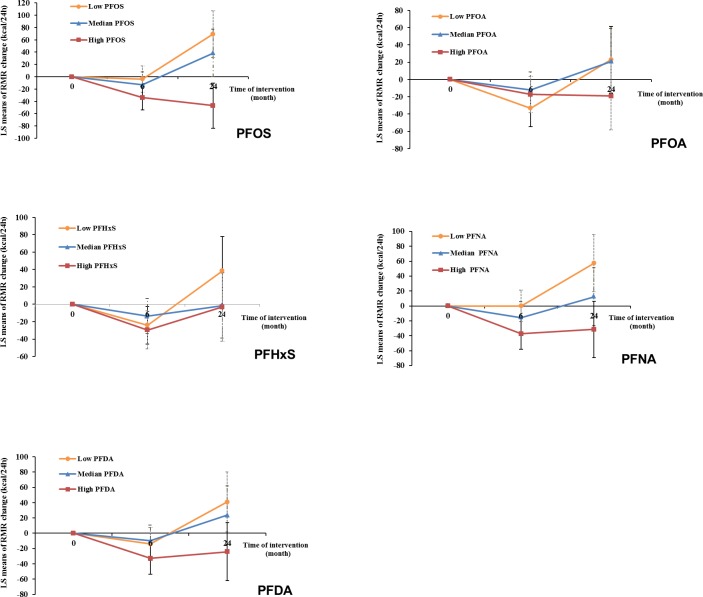
Fig 2. Trajectory of changes in RMR of all participants according to tertiles of PFAS concentrations.
Data were adjusted for age, sex, race, education, smoking, alcohol consumption, physical activity, menopausal status (women only), hormone replacement therapy (women only), dietary intervention group, baseline free T3 and free T4 levels, and baseline RMR. LS, least-square; PFAS, perfluoroalkyl substance; PFDA, perfluorodecanoic acid; PFHxS, perfluorohexanesulfonic acid; PFNA, perfluorononanoic acid; PFOA, perfluorooctanoic acid; PFOS, perfluorooctanesulfonic acid; RMR, resting metabolic rate; T3, triiodothyronine; T4, thyroxine.

