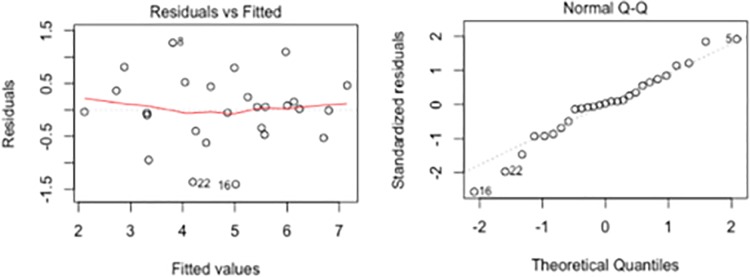
Fig 1. Fitted vs residuals plot and Q-Q plot of standardized residuals of model A.
The two plots show that the residuals seem to be symmetrically distributed around 0 and in general clear patterns are not present. Therefore, the residuals are approximately normally distributed around 0 and a linear regression with a logarithmic transformation of the number of ZIKV cases appropriately models our data.

