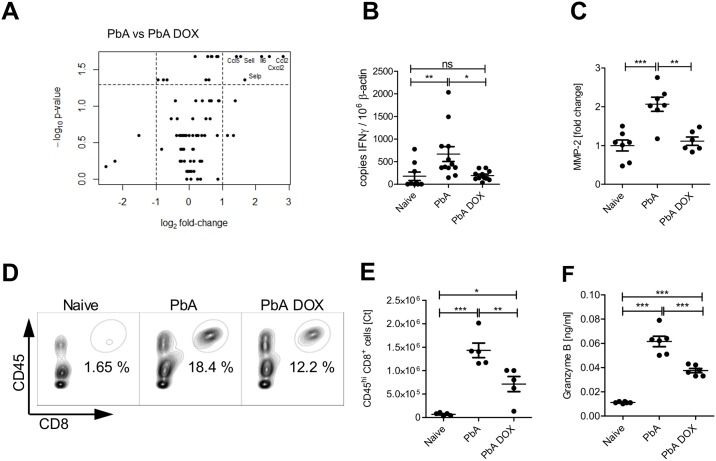
Fig 2. DOX regulates inflammatory responses and tissue degrading enzyme activity in brain cells of PbA infected animals.
C57BL/6 mice were left naïve or infected with PbA as described above and indicated groups received DOX (80 mg/kg/day) from dpi 4–6. Six days post PbA infection, brain tissue of naïve mice and PbA infected mice ± DOX was examined for inflammatory responses and MMP activity. (A) RNA was prepared from brain tissue and analyzed via PCR array. Volcano plot analysis of the comparison PbA versus PbA DOX: Shown is the logarithmic fold-change (x-axis) against the negative logarithmic p-value (y-axis). The dashed lines indicate where p ≤ 0.05 and FC ≥2. (B) Additionally, IFN-γ was analyzed by RT-qPCR in the brain tissue of all groups (C) Quantification of MMP-2-specific zymography. Brain tissue extracted on dpi 6 was subjected to zymography and quantified by scanning densitometry of the gelatinolytic bands of MMP-2. Representative experiments are shown with 6–7 mice/ group. Relative scanning units of MMP-2 are shown as fold change against expression of naïve animals displayed as median (D) Characterization of brain leukocytes on dpi 6 from naïve, PbA and PbA+DOX-treated animals. Flow cytometry gating scheme to identify CD8+T cells is shown for representative animals from naïve and infected ± 80 mg/kg/day DOX mice. (E) Absolute numbers of brain infiltrating CD45hiCD8a+ cells as determined by FACS. (F) Brain tissue supernatant from dpi 6 was analyzed with an ELISA for granzyme B. (B, C, E, F) *p<0.05, **p<0.01, ***p<0.001, ANOVA with Tukey’s post test on data after analysis of normal distribution.

