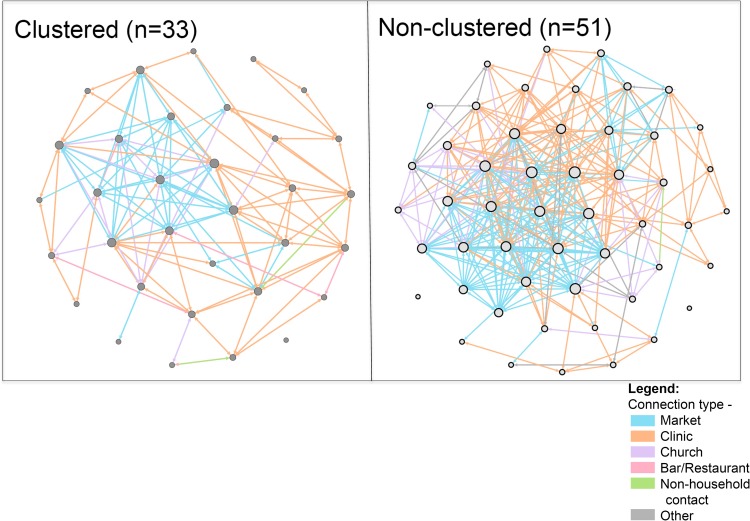
Fig 2. Social-location networks of genotype-clustered vs. non-clustered TB cases in Tororo, Uganda.
Each network node represents a participant with culture-positive TB, with node size proportional to node degree. Each network edge represents a specific shared location, with edge colors indicating the location type, as indicated in the legend.

