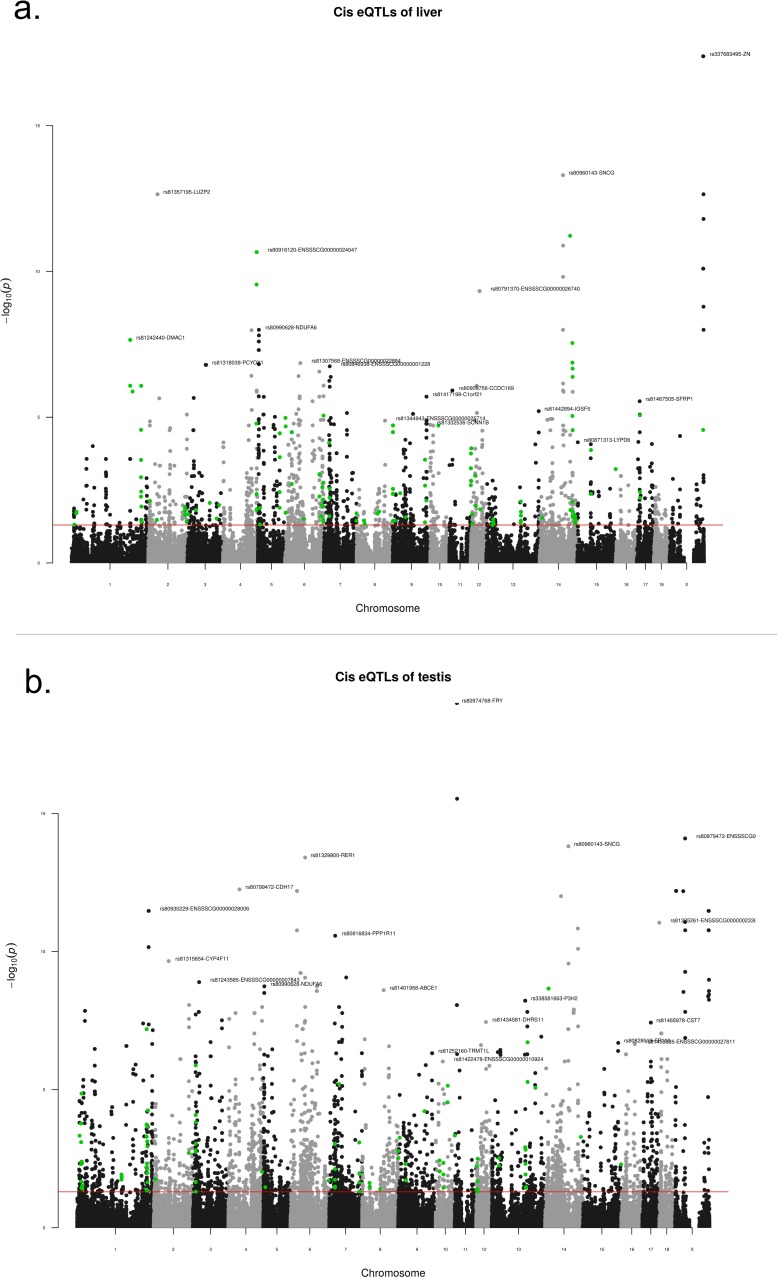
Fig 1.
Identification of significant cis-acting eQTLs in porcine (a) liver and (b) testis. Y-axis indicates the negative logarithm of False Discovery Rate for each eQTL, X-axis indicates chromosome number. Only the X chromosome is shown, as no eQTLs were discovered on Y chromosome. Red line indicates a FDR threshold of 0.05 which defined the eQTLs with a significant gene-SNP association. For each chromosome, the eQTLs with lowest FDR values are illustrated with SNP rs number and gene symbol. Green circles indicate “filtered eQTLs” which had a significant (FDR < 0.05) association with sire-obtained summarised estimated breeding values for skatole and human nose scores and were used in the subsequent analyses.

