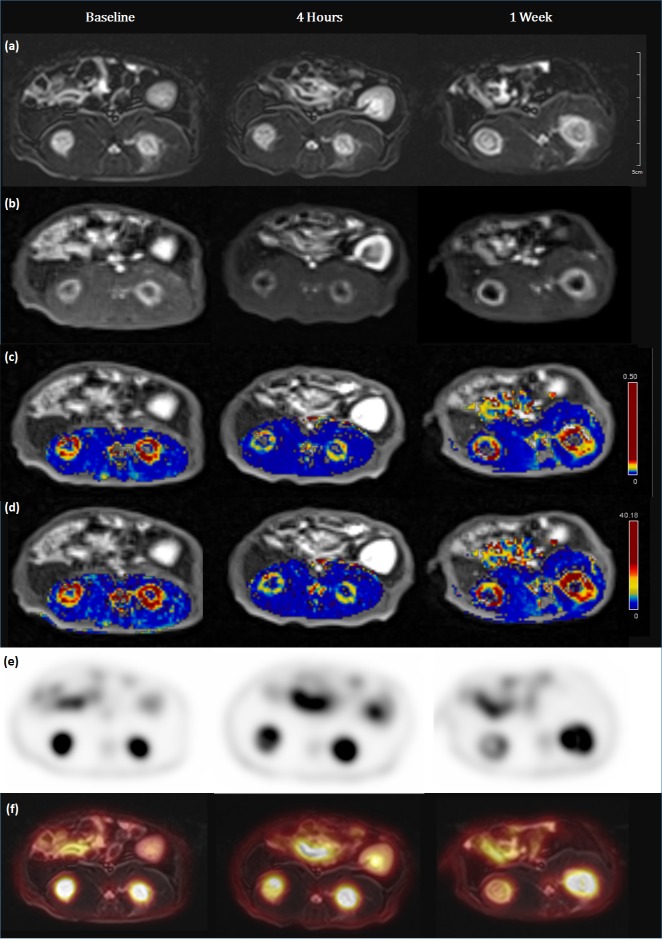
Fig 1. Serial changes of PET/MRI parameters before and after the treatment with CKD-516.
(a) Axial T2-weighted images demonstrated target tumors with high signal intensity in bilateral paravertebral muscles. (b) DCE-MRI revealed peripheral enhancement of tumors suggesting central necrosis. (c) Ktrans map and (d) iAUC map demonstrated a reduction of values at 4 hours and partial recovery at 1 week follow-up. (e) PET images and (f) fusion images showed no significant differences of SUVmax or SUVmean.

