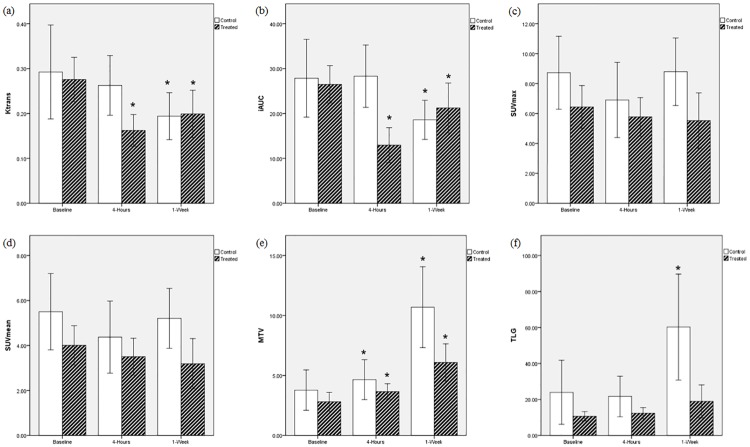
Fig 2. Serial measurement of (a) Ktrans, (b) iAUC, (c) SUVmax, (d) SUVmean, (e) MTV and (f) TLG at different time points.
* is a significant change compared to the baseline.
Ktrans: volume transfer coefficient
iAUC: initial area under the gadolinium concentration-time curve until 60 seconds
SUV: standardized uptake value
MTV: metabolic tumor volume
TLG: total lesion glycolysis.

