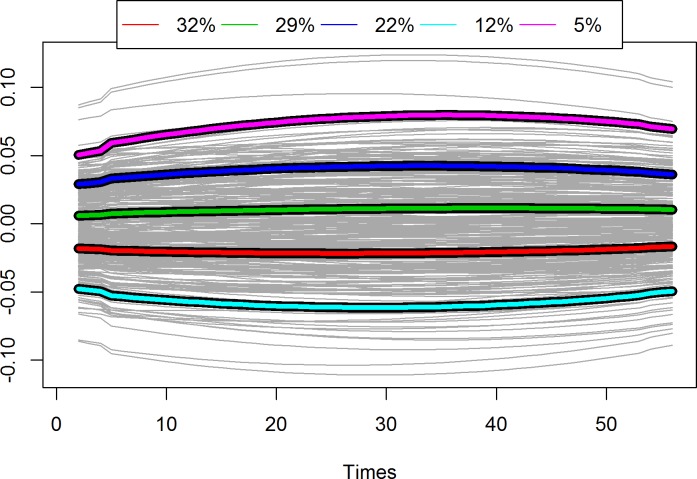
Fig 5. Individual RLTL profiles (grey) and five cluster curves.
Of all animals 31% shortened their RLTL slightly in early life (red curve), 30% maintained their RLTL over life (green curve), 22% showed mild elongation in early life (blue curve), 12% more obvious elongation (pink curve) and 4% more obvious telomere attrition (cyan curve).

