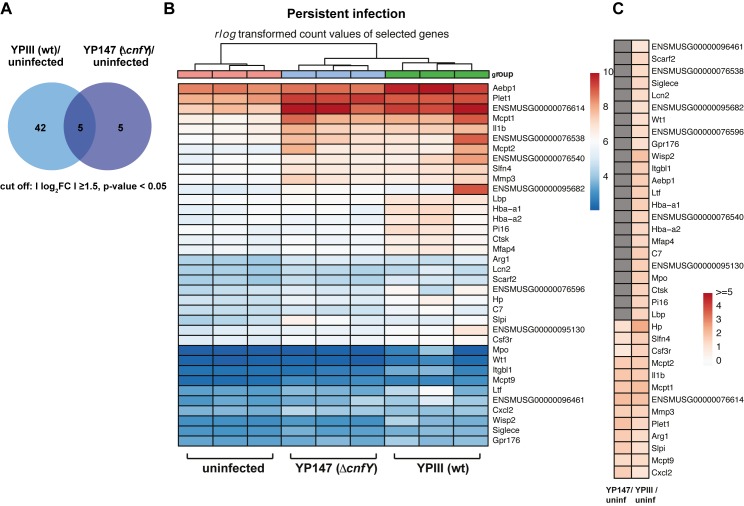
Fig 6. The host transcriptome during persistent Yersinia infection in the presence and absence of the CNFY toxin.
(A) Venn-diagram of differential expressed genes (cut off: Ilog2FCI≥1.5) from uninfected at 42 dpi versus YPIII or YP147(ΔcnfY) at 42 dpi. (B) Heat map of top enriched (red) and depleted (blue) host transcripts based on DESeq2 analyses. Color-coding is based on rlog transformed read count values. (C) Heat map illustrates log2 fold changes of host transcripts detected in YPIII- or YP147(ΔcnfY)-infected mice compared to uninfected mice (adjusted P value ≤ 0.05). Grey boxes: not significant.

