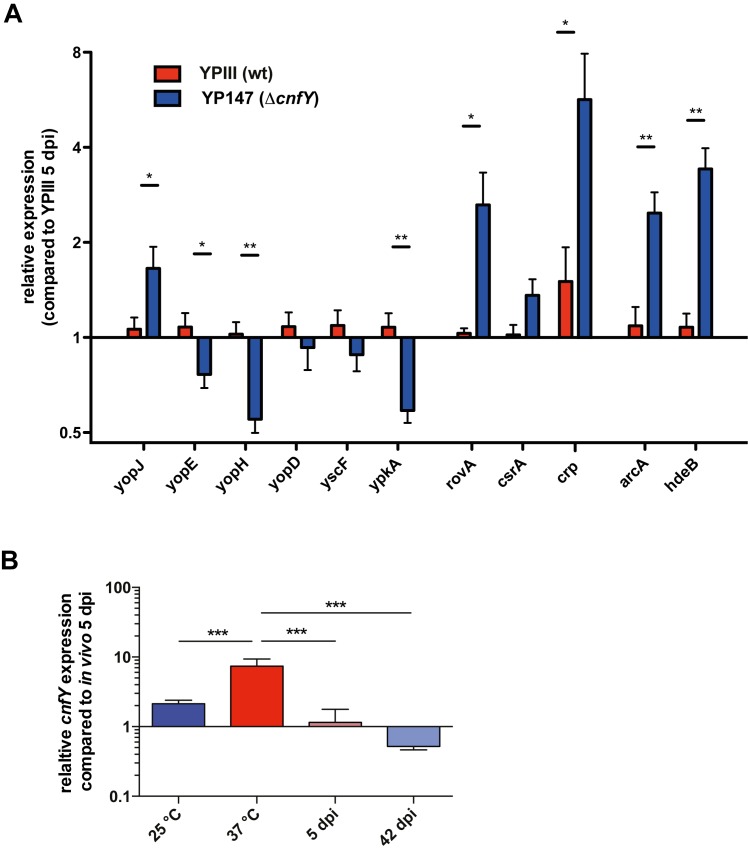
Fig 8. Expression pattern of Yersinia persistence genes.
(A) Relative changes in transcript abundance of selected Yersinia genes in YPIII- or YP147 (ΔcnfY)-infected ceca 5 dpi. qRT-PCR was performed with total RNA from Tissue RNA-seq samples. (B) Relative expression of cnfY from total RNA from YPIII- or YP147 (ΔcnfY) grown in vitro at 25°C and 37°C, and isolated from infected ceca 5 and 42 dpi. The data show the mean +/- SEM of at least three independent experiments performed with at least two technical replicates and were analyzed by multiple t-tests employing Holm-Šídák’s correction, P-value: * <0.05, ** <0.01.

