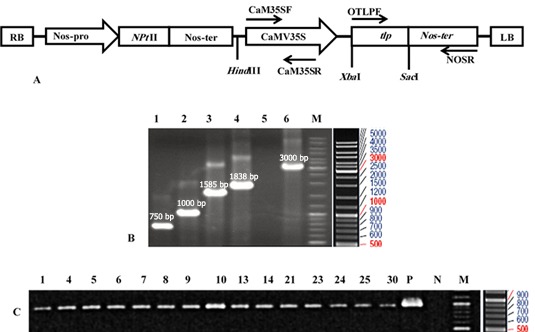
Figure 1.

The schematic representation of the T-DNA region of pBITLPRA1 construct (A), PCR of the tlp gene in pBITLPRA1 vector, and the expected band size (B) as well as putative transgenic canola plants (C). A: pBITLPRA1 construct with the expected restriction pattern; RB: right border, Nos-ter: nopaline synthase terminator, NptII: neomycin phosphotransferase II, Nos-P: nopaline synthase promoter, and tlp: Rice tlp, LB: Left border. B: Lane1: OTLPF/OTLPR primers, Lane2: OTLPF/Renos primers, Lane3: Fe35s/OTLPR primers, Lane4: Fe35S/Renos primers, Lane5: negative control and Lane6: positive control (pBIGUS+), M: DNA ladder mix, C: PCR analysis of tlp gene in the putative transgenic canola plants (1–15transformants) by using OTLPF/Renos primers, band size 1000 bp, P: Positive control (Plasmid pBIRATLPRA1), N: Negative control (wild-type), and M: DNA ladder mix
