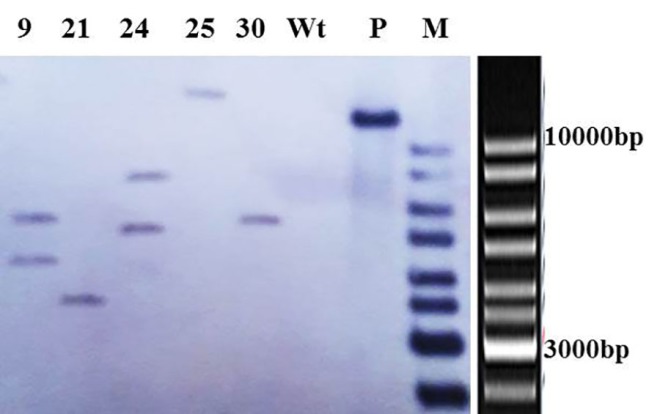
Figure 3.

Southern blot analysis of the HindIII-digested genomic DNA from the representative pBITLPRA1-transformed plants (i.e., PCR-positive plants having the highest enzyme activity) in the T0 generation; the number of bands reflects the number of transgene’s insertions, Wt: non-transgenic plant, P: Positive control (linear pBITLPRA1 by HindIII) and MW: DNA ladder mix.
