. 2014 Nov 24;6(2):1272–1276. doi: 10.1039/c4sc02714k

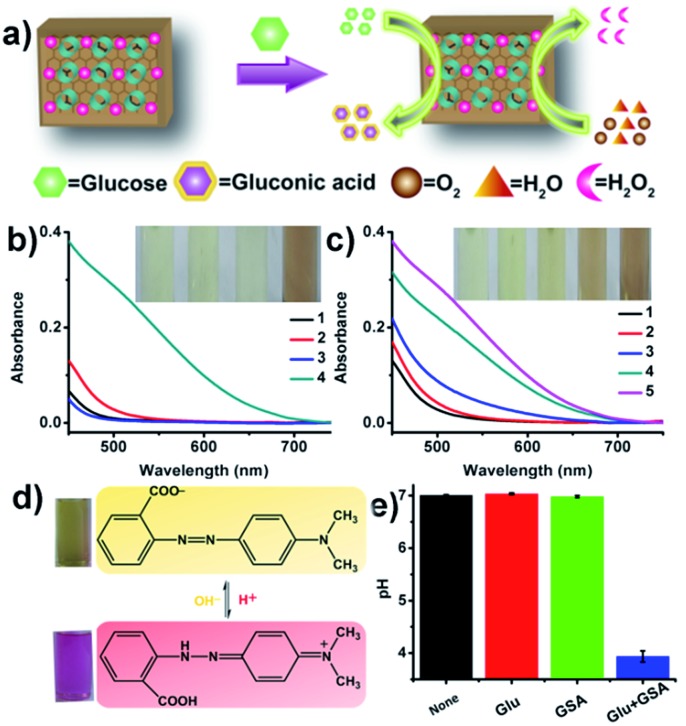
Fig. 4. The GOx-like catalytic activity of the GSA sheets. (a) Schematic illustration of GSA-catalyzed glucose oxidation to produce gluconic acid and H2O2. (b) Relative absorbance spectra and visual color changes for different samples obtained by a gluconic acid-specific assay: (1) none; (2) only glucose; (3) GSA alone; (4) glucose and GSA ([glucose] = 200 mM, [GSA] = 900 μg mL–1). (c) Relative absorbance spectra and visual color changes in the absence or presence of different concentrations of GSA (1 to 5: 0, 100, 300, 600, 900 μg mL–1). (d) Typical photographs and corresponding chemical structures of methyl red without or with glucose and GSA in phosphate buffer (0.5 mM, pH 7.0). (e) pH change for different samples in phosphate buffer (0.5 mM, pH 7.0).

Fig. 4