. 2014 Nov 12;6(2):1011–1017. doi: 10.1039/c4sc02328e

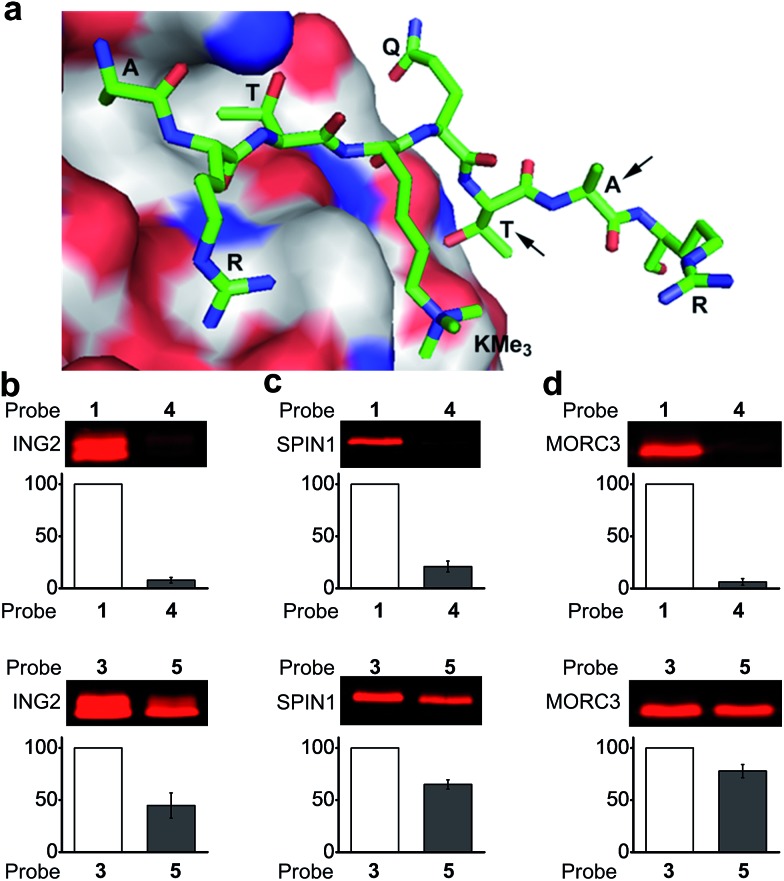
Fig. 3. (a) The crystal structure of the PHD finger of ING2 binding to an H3K4Me3 peptide (PDB ; 2G6Q). The arrows indicate the residues where the photoreactive groups (i.e., benzophenone and diazirine) were incorporated into probes 1, 3, 4 and 5. The labelling of (b) ING2, (c) SPIN1 and (d) MORC3 by probes 1 and 4 (upper panel), and by probes 3 and 5 (lower panel). The indicated proteins (20 ng μL–1) were photo-labelled (365 nm) with probes (2 μM) 1 and 4 for 1 h, and with probes 3 and 5 for 20 minutes, respectively. The labelled proteins were conjugated to rhodamine-azide and detected by in-gel fluorescence scanning. The column charts show the relative fluorescence intensities of the labelled protein bands. The fluorescence intensities of probe 1- and 3-labelled proteins were set to 100%. Data are averages ± s.e. (n = 2).

Fig. 3