. 2014 Nov 19;6(2):1301–1307. doi: 10.1039/c4sc03027c

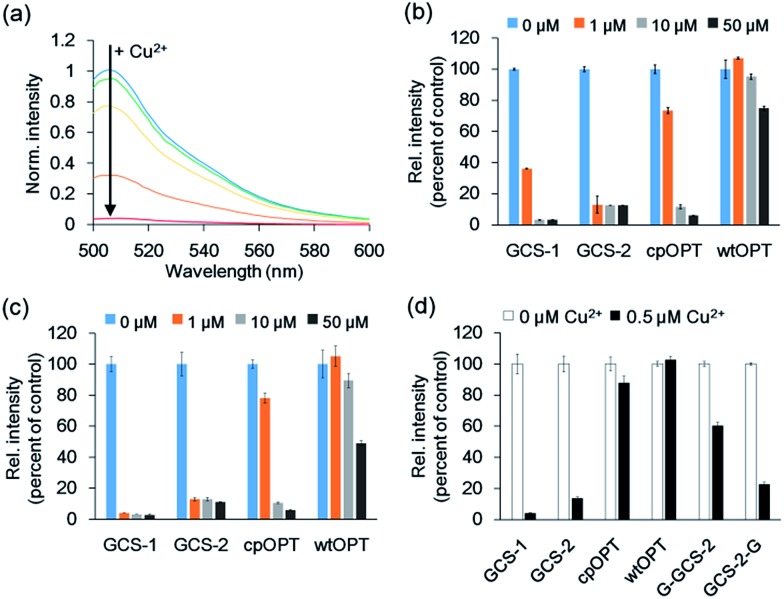
Fig. 2. Fluorescence responses of GCS sensor proteins. (a) Fluorescence responses of 1 μM GCS-1 <5 min after the addition of 0, 0.4, 0.8, 1.6, and 3.2 μM Cu2+. (b) Fluorescence responses of 0.5 μM protein <5 min after the addition of 0, 1, 10, and 50 μM Cu2+. cpOPT: circularly permuted green fluorescent protein lacking the ATCUN motif; wtOPT: wild-type green fluorescent protein. (c) Fluorescence responses of 0.5 μM protein 1 h after the addition of 0, 1, 10, and 50 μM Cu2+. (d) Fluorescence responses of 0.1 μM protein 1 h after the addition of 0 and 0.5 μM Cu2+. The error bars correspond to the standard error of the mean of three independent measurements.

Fig. 2