. 2014 Nov 19;6(2):1301–1307. doi: 10.1039/c4sc03027c

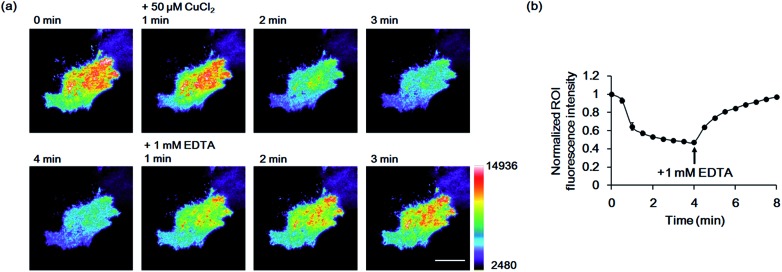
Fig. 5. Imaging of Cu2+ on live HeLa cell surfaces by GCS-2. (a) Pseudocolored images from 1 min prior to Cu2+ addition to 1, 2, 3 and 4 min after the addition of 50 μM Cu2+, and 1, 2 and 3 min after the addition of 1 mM EDTA. Images were collected using total internal reflection fluorescence (TIRF) microscopy. The color bar represents the fluorescence intensity in the GFP channel (excitation at 488 nm). Scale bar: 20 μm. (b) Plot of the average fluorescence response of 13 cells vs. time after 50 μM Cu2+ addition. All fluorescence intensity values were subtracted by background signals and normalized by the fluorescence before Cu2+ addition. The time of 1 mM EDTA addition is shown. The error bars correspond to the standard error of the mean value of 13 individual cells.

Fig. 5