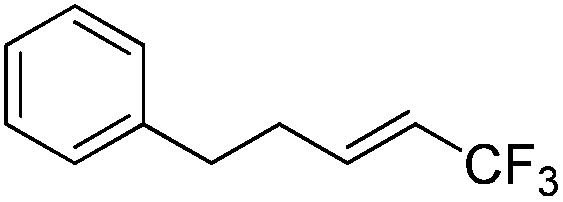
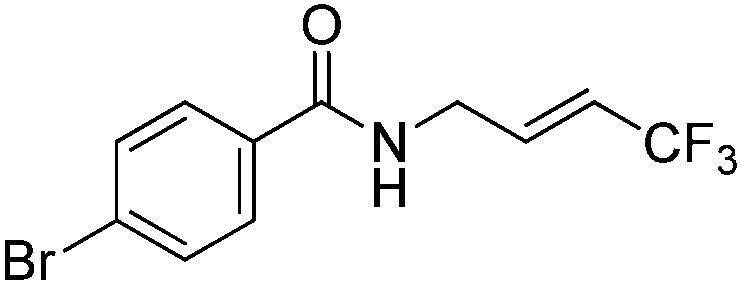
Table 2. Photoredox catalytic trifluoromethylation of alkenes a .

| |||
| Entry | Product |
Yield b (%; E/Z ratio c ) | |
| 1 | 2a |

|
97 (25 : 1) |
| 2 | 2b |

|
82 (25 : 1) |
| 3 | 2c |

|
85 (30 : 1) |
| 4 | 2d |

|
95 (25 : 1) |
| 5 | 2e |

|
95 (25 : 1) |
| 6 | 2f |

|
94 (25 : 1) |
| 7 | 2g |

|
88 (only E) |
| 8 | 2h |

|
89 (40 : 1) |
| 9 | 2i |

|
96 (25 : 1) |
| 10 | 2j |

|
89 (25 : 1) |
aAn oven-dried resealable test tube equipped with a magnetic stirrer bar was charged with an alkene (0.50 mmol), sealed with a screw-cap, and degassed by alternating between putting under vacuum and backfilling with argon. A solution of Ptppy (1.0 mol%, 0.0050 mmol) in CH3CN (2.0 mL, 0.25 M) and DBU (1.0 mmol) was then added to the tube under argon. CF3I (1.5 mmol) was then delivered to the reaction mixture using a gastight syringe. The test tube was placed under blue LEDs (7 W) at room temperature for 5–10 h, and the progress of each reaction was monitored by TLC or gas chromatography.
bThe given yields are isolated yields reported as the average of two runs, except for 2b (entry 2), which was monitored using 19F NMR due to the volatility of the product.
cThe E/Z ratio was determined by 1H NMR spectroscopy and gas chromatography.
