. 2014 Nov 14;6(2):1288–1292. doi: 10.1039/c4sc02930e

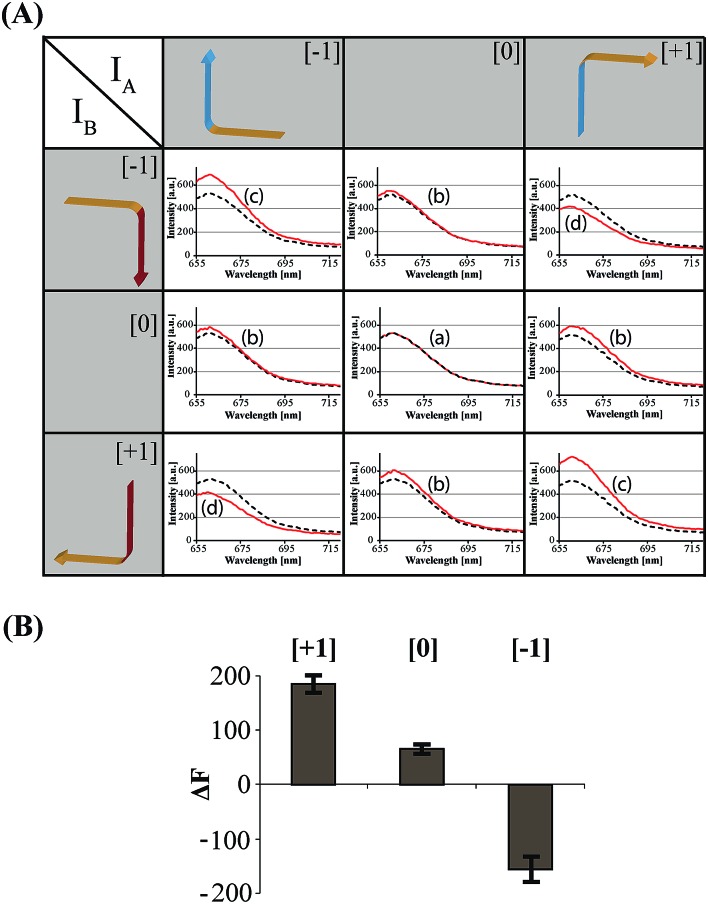
Fig. 2. (A) Fluorescence spectra corresponding to the products generated upon interaction of the three-valued inputs with the hairpin computing module. The fluorescence intensities of the system in comparison to the background fluorescence of the computing module represent the output of the states of the multiplication table (black dashed line – initial fluorescence spectra of the computing module; red continuous line – fluorescence spectra of the system subjected to the respective input values). (B) Fluorescence changes, ΔF, at λ = 665 nm corresponding to the output values [–1], [0], and [+1]. Error bars were derived from N = 4 experiments.

Fig. 2