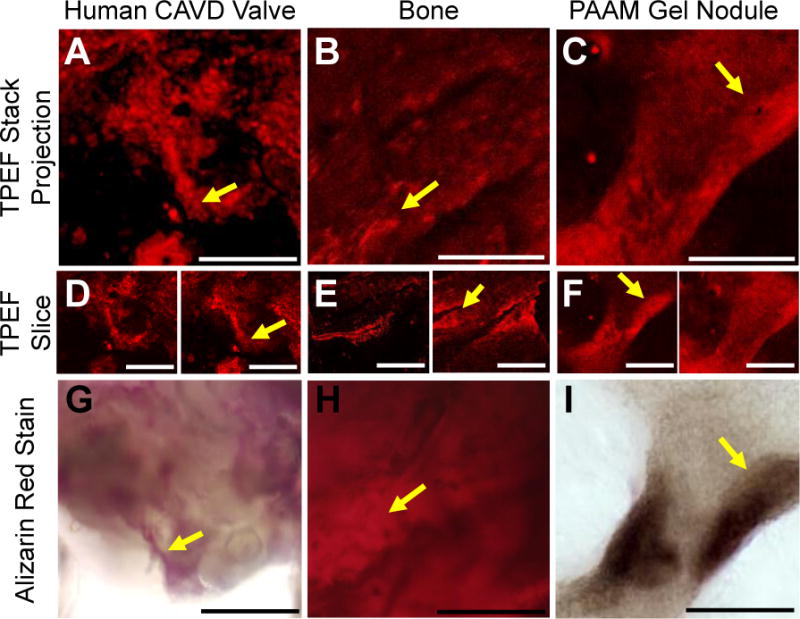
Figure 1.

Visual analysis of TPEF images compared to Alizarin Red staining of a human CAVD nodule, a rat bone, and a PAAM gel grown nodule. Two-photon excited autofluorescence and Alizarin Red staining for mineralization within CAVD human valves (A, D, G), rat bone (B, E, H) and nodules grown on PAAM gels seeded with rat VICs (C, F, I). Projections of TPEF image volumes (A, B, C) were created by averaging individual depth-resolved optical sections (D, E, F). The endogenous TPEF patterns are consistent with the spatial distribution of subsequent Alizarin Red staining of the same region (G, H, I). Yellow arrows show features similar between the TPEF and Alizarin Red images. Scale bars are 50 μm.
