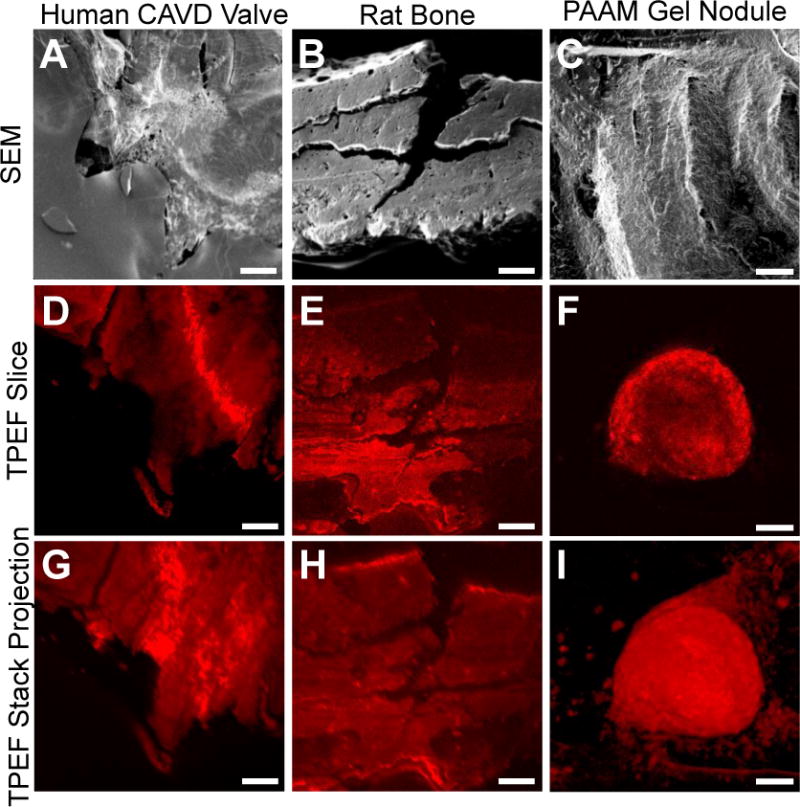
Figure 2.

Representative images of human CAVD nodules, rat bone samples, and PAAM gel nodules taken using SEM and TPEF. SEM images of nodules from a human CAVD valve (A), rat bone (B) and PAAM gels (C) show the topography of the different types of calcific nodules. Representative TPEF slices (D, E, F) and intensity projections of the image volumes (G, H, I) also demonstrate the ability to identify textural patterns between calcified samples. Scale bars are 100 μm.
